
Price is an outcome. It's driven by how much the grid generates and how much it needs, block by block. So before Sparko forecasts a price, it forecasts generation and demand across India, from the whole country down to a single plant.
When solar floods the grid at noon, prices fall, a battery should charge. When the sun sets and demand ramps, prices spike, a battery should discharge. Getting that right starts with forecasting the two forces underneath every price: what's being produced, and what's being consumed.
Sparko forecasts how much power each fuel will produce, solar and wind that swing with the weather, and the thermal, hydro and nuclear that fill the gaps. It runs at national, regional and state level, so you see supply the way the grid actually sees it.


Demand has a rhythm, a morning rise, a midday dip, a sharp evening peak, bent by weather, weekends and festivals. Sparko forecasts load for every major region so the optimiser knows when power will be scarce and valuable, and when it will be cheap and abundant.
The same forecast, at every zoom level, so you can see the whole country's balance or drill into a single asset's neighbourhood, for the day ahead or the next fifteen minutes.
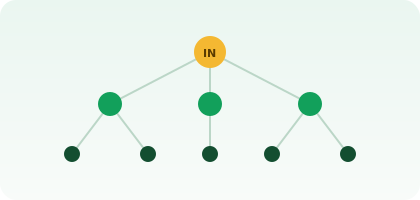
India's total generation and demand balance.
Northern, Western, Southern, Eastern & North-Eastern grids.
State-level supply and load, where markets clear.
Down to an individual asset's local picture.
Every level resolves from the day ahead to each 15-minute block.
Generation by fuel, and load, for every block.
Demand minus renewables, what the market must still cover.
Net load and congestion shape the clearing price.
Charge into the surplus, discharge into the scarcity.
Our generation and demand models are validated on multi-year historical data and tracked block by block. Tighter forecasts here are what make the price forecasts, and the bids, trustworthy.
Figures are backtested on historical data and vary by region and season.
Book a demo and we'll walk you through the generation, demand and price forecast for a day on your grid.