Refresh the world.
Read market, forecast and asset state.
SPARKO turns prices, forecasts and battery limits into a clear schedule: what to charge, hold or discharge—and why.
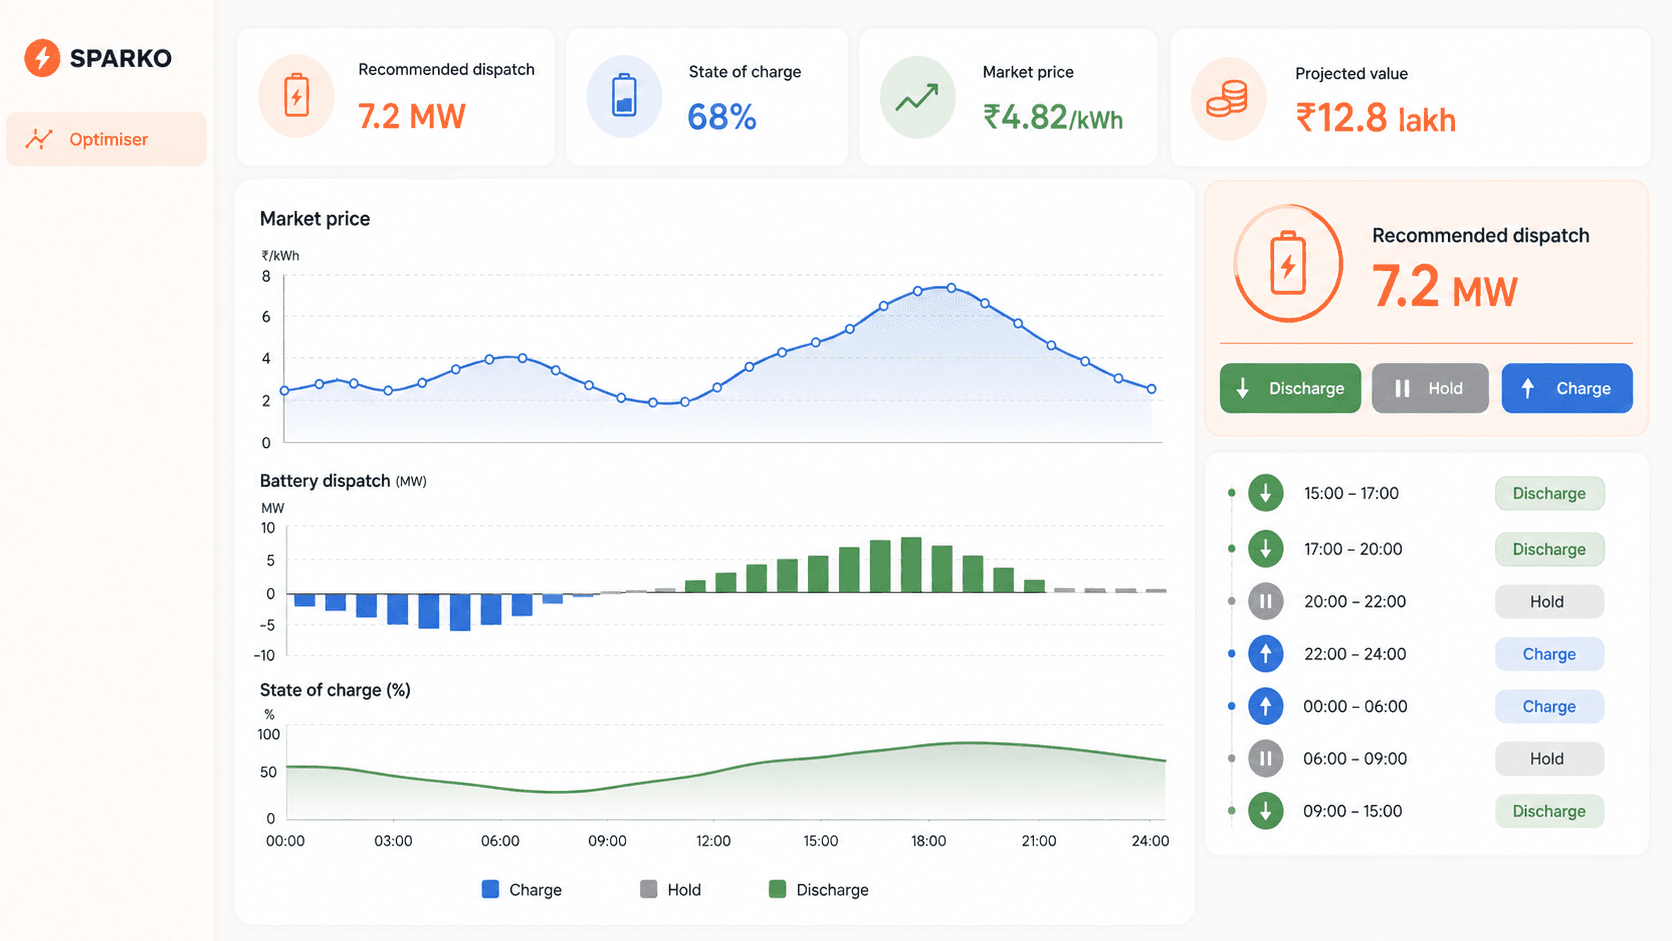
Watch the optimiser compare options, check asset limits and turn an approved plan into charge and discharge instructions.

Bring together expected price, generation and demand over the planning horizon. Uncertainty matters: tomorrow is a range of possibilities, not one certain price curve.
Conceptual equipment layout and illustrative operation. Equipment-specific limits and controls vary by installation.
Objective-aware optimisation
Explore how the same signals and battery state produce a different operating plan for a buyer, seller or merchant.
Open-access C&I · EV charging · Data centre
SPARKO combines the exchange price, site load, tariff, grid limits and charge deadline. The battery fills in low-cost blocks and supports the site through costly peaks.
Interactive illustration only. Values are simulated to explain the control logic; they are not a savings or revenue forecast.
Every fifteen minutes
Each result passes through a visible chain that an operator can inspect, approve and replay.
Read market, forecast and asset state.
Test eligible schedules and bids.
Reject unsafe or infeasible outcomes.
Value, risk, reserve and terminal state.
Instruction, meter, settlement and P&L.
Verified execution
One-year software-in-the-loop backtesting on a simulated 10 MW / 20 MWh BESS checked feasibility and objective fulfilment across 105,120 fifteen-minute intervals.
Bring the asset, site and objective. We will map the data boundary, twin and commercial decision flow.